
Test How PPO Clipping and Update Choices Change Learning
You bump clip_range from 0.2 to 0.3. The curve climbs higher. You conclude clipping matters.

Key topics
You bump clip_range from 0.2 to 0.3. The curve climbs higher. You conclude clipping matters.
You changed one seed, not one variable. That single curve is a measurement, not a result. A PPO run is one sample drawn from a distribution over seeds — initialization, environment sampling, and action sampling all shift from run to run. Two identical configurations can produce curves that cross, reverse, and disagree. If you want to know whether a hyperparameter actually helped, you have to measure the distribution, not the line.
This is a measurement exercise. You will build a small harness that varies one knob at a time across a fixed seed set, then read the paired differences instead of the raw means. The payoff is a decision rule you can reuse: an effect is worth acting on only when the paired per-seed difference is consistent and larger than the uncertainty around it.
Why One PPO Run Cannot Answer a Hyperparameter Question
A single training curve mixes two things: the effect of the hyperparameter you changed, and the seed-driven variance you did not control. When you compare two single runs, you are comparing two samples, not two settings. The difference you observe is the sum of the real effect and the noise — and you have no way to separate them.
The unit of analysis is the seed, not the episode. You are comparing distributions of final returns, not two lines on a plot. This extends the evaluation reasoning you already have: repeated episodes and seeds are the baseline, and this article pushes that into a controlled A/B comparison.
Note: If you have not already built the habit of evaluating across seeds, do that first. A hyperparameter sweep on top of a single-seed evaluation just produces more confident noise.
State the decision rule before you run anything: an effect is worth acting on only if the paired per-seed difference is consistent and larger than the uncertainty around it. Everything below exists to make that comparison possible.
Knowledge check
Check your understanding
Answer this question before you continue.
What You Need Before You Start
Assume you already have a compact PPO learner that trains on a small benchmark and prints episode return plus update diagnostics. If you do not, build that first — this article assumes it exists and focuses on the experiment layer.
You need four pieces:
- A PPO implementation with configurable
clip_range,n_epochs, and learning rate. - A way to set both the environment seed and the framework seed (numpy/torch).
- A logging path that writes per-seed results to disk.
- A benchmark small enough that a full sweep finishes in a reasonable time on a laptop CPU.
Keep the benchmark small. This is a measurement exercise, not a benchmark chase. A task that trains in a few minutes per run lets you afford five seeds across several settings; a task that takes hours does not.
You will vary two knobs:
clip_range— the clipping coefficient. This is the knob most people reach for first, and the one most likely to be inert if your policy is not moving far per update.n_epochs— the number of optimization passes over each batch of collected data. This is the cleanest first update choice because it directly controls how far the policy moves per data batch.
Warning: Results here are about this environment and this implementation. They are not a universal claim about PPO. Treat every conclusion as local until you reproduce it somewhere else.
Build the Smallest Harness That Varies One Thing
The harness has one job: run a config, return a record. Keep it boring.
import csv
import numpy as np

def run_config(config):
    """config: dict with clip_range, n_epochs, seed"""
    set_seeds(config["seed"])
    agent = PPO(clip_range=config["clip_range"], n_epochs=config["n_epochs"])
    history = train(agent, env, total_steps=STEPS)
    return {
        "clip_range": config["clip_range"],
        "n_epochs": config["n_epochs"],
        "seed": config["seed"],
        "final_return": np.mean(history["return"][-20:]),
        "return_spread": np.std(history["return"][-20:]),
        "mean_kl": np.mean(history["kl"]),
        "mean_clip_frac": np.mean(history["clip_fraction"]),
    }

def sweep(settings, seeds):
    rows = []
    for seed in seeds:              # outer loop: seed
        for setting in settings:    # inner loop: setting
            cfg = {**setting, "seed": seed}
            rows.append(run_config(cfg))
    return rows
The loop order matters. Seeds on the outside, settings on the inside means every setting sees the identical seed set. That gives you a paired comparison — you can compare setting A and setting B on the same seed, which cancels a large chunk of the seed variance. Two independent piles of runs cannot do that.
Write one row per run to CSV. Resist the urge to plot before the table exists. The table is the artifact; the plot is decoration.
clip_range,n_epochs,seed,final_return,return_spread,mean_kl,mean_clip_frac
0.2,10,0,412.3,58.1,0.008,0.11
0.2,10,1,388.7,61.4,0.009,0.13
0.3,10,0,431.9,72.6,0.014,0.22
...
Keep the harness deliberately boring: no early stopping, no reward normalization changes, no architecture edits between settings. Every change you make between settings is a variable you did not control.
Knowledge check
Check your understanding
Answer this question before you continue.
Which Diagnostics Actually Tell You Something
Return alone tells you that something changed. Diagnostics tell you why. For this experiment, log two things beyond return: approximate KL divergence and clip fraction. These are the minimum set that lets you interpret a clipping or epoch comparison. Entropy and value loss are useful follow-up signals, but they are not required to answer the question this experiment asks.
Approximate KL divergence between the old and new policy per update is the direct readout of how far each update moved the policy. If KL is tiny, your updates are tiny, and no clipping setting will matter.
Clip fraction — the share of samples whose probability ratio hit the clipping boundary — tells you whether clipping is active or effectively inert. This is the diagnostic people skip and then wonder why clip_range did nothing.
Here is the mechanism that makes clip fraction the key signal: clipping only changes behavior when the ratio actually reaches the boundary. If your clip fraction is near zero, the ratio never got close to 1 ± clip_range, so changing clip_range from 0.2 to 0.3 changes nothing. You did not test clipping. You tested a number that was never consulted.
Common mistake: Reading a single diagnostic in isolation. The useful pattern is return, KL, and clip fraction moving together. Return up with KL flat and clip fraction flat means you probably got lucky on seeds, not that you found an effect.
Knowledge check
Check your understanding
Answer this question before you continue.
Run the Sweep and Read the Paired Differences
Run the baseline setting across at least five seeds before touching any knob. That spread is your noise floor — the amount of variation you should expect from seed alone. Everything you measure later gets compared against it.
Then vary clip_range alone across a small set of values, holding seeds, n_epochs, learning rate, and environment fixed. Then vary n_epochs alone at the baseline clip_range, again holding everything else fixed.
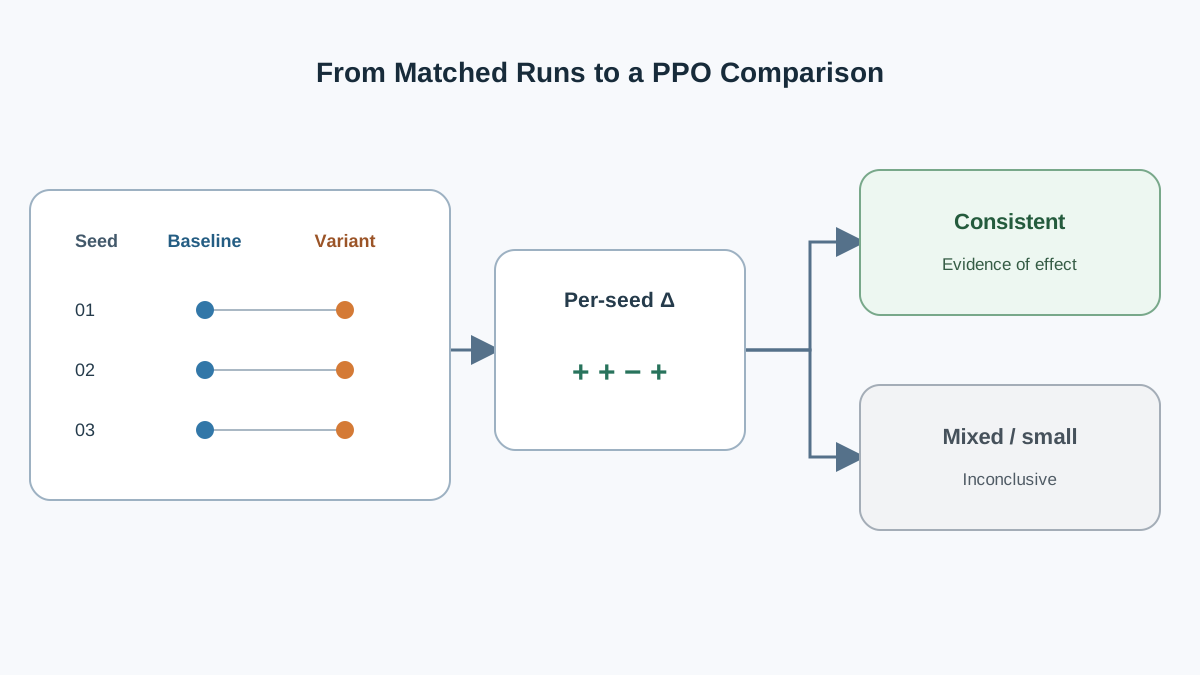
Summarize each setting as median plus spread across seeds, but make the paired per-seed difference the primary unit of interpretation. For each seed, compute the difference between the two settings you are comparing. That gives you a distribution of differences — one number per seed — and you read the consistency of that distribution rather than comparing two separate means.
| Setting | Median return | Spread (IQR) | Mean KL | Mean clip frac |
|---|---|---|---|---|
| clip=0.2, epochs=10 | 401 | 44 | 0.008 | 0.11 |
| clip=0.3, epochs=10 | 418 | 51 | 0.014 | 0.22 |
| clip=0.2, epochs=20 | 396 | 47 | 0.019 | 0.18 |
Read that table carefully. The clip=0.3 row has a higher median than baseline, but the spread is wider. To decide whether that difference is real, look at the paired per-seed differences: if the clip=0.3 run beats the clip=0.2 run on the same seed in most seeds, and the differences are consistent in sign, you have evidence of an effect. If the differences flip sign across seeds, you have noise.
The practical rule: if the paired per-seed differences flip sign or are small relative to their own spread, treat the result as inconclusive — not as proof of no effect. Increase seeds before you increase settings. More settings on a noisy base just produces more noise.
Note: A paired difference that is consistently positive but small is still evidence. A paired difference that is large on average but flips sign across seeds is not. Consistency matters more than magnitude when your seed count is low.
Knowledge check
Check your understanding
Answer this question before you continue.
When the Result Looks Wrong
Real experiments fail in recognizable ways. Here is how to tell a broken harness from a genuine null result.
All seeds collapse to the same return. Check that the seed is actually being applied to both the environment and the policy initialization. A seed that only touches one of them gives you correlated runs that look stable and mean nothing.
Clip fraction stays near zero across every clip_range value. The policy is not moving far enough per update for clipping to matter. This is itself a finding — about your learning rate or epoch count, not about clipping. Raise n_epochs or the learning rate and re-check.
Return improves but KL explodes. The policy is drifting far from the behavior policy, and the clipped objective is not containing it. This is a known limitation of PPO, not a bug in your harness. The clip is a soft constraint, not a wall.
Huge spread with no separation between settings. You need more seeds, not more settings. Five seeds is a floor, not a target.
Diagnostics logged but never inspected. If you cannot say what the clip fraction was, you cannot explain why the return changed. The number is the explanation.
One Modification Worth Trying Next
Add a third axis. Hold clip_range and n_epochs fixed and vary the learning rate, then ask whether the clip_range effect you measured survives a different step size.
This tests interaction, not just main effect. A hyperparameter that helps at one learning rate and hurts at another is a different claim than "clipping helps." The first claim is conditional and useful; the second is probably false.
Keep the same seed set so the comparison stays paired and the noise floor stays comparable. Record the outcome even if it is inconclusive. A null interaction result is a legitimate finding — it tells you the two knobs are separable in this regime, which is real knowledge about your system.
The Rule You Keep
Never accept a PPO hyperparameter claim from one run. Compare paired seeds against a measured noise floor. Treat diagnostics as the explanation for why a return difference appeared or failed to appear.
That rule is portable. It applies to clip_range, n_epochs, learning rate, entropy coefficient, and every other knob you will ever tune. The harness changes; the measurement discipline does not.
Your next step: extend the harness to a second environment. If the clip_range effect survives a different task, you have something closer to a general claim. If it vanishes, you learned that your first result was local — which is exactly the kind of knowledge a controlled sweep is supposed to produce. A null result from a clean experiment is not a failed experiment. It is the experiment working.
Knowledge check
Final check
Finish the article by checking the ideas you just learned.
References
Build a stronger RL mental model
Use structured resources to connect equations, algorithms, and observable agent behavior.


